


Overall Analysis
Bitcoin made an all-time high of $81,751, continuing its rally for six consecutive trading sessions. Trump’s win has fueled Bitcoin’s rise.
Ethereum successfully closed above a major resistance level, and the rally seems poised to continue upward.
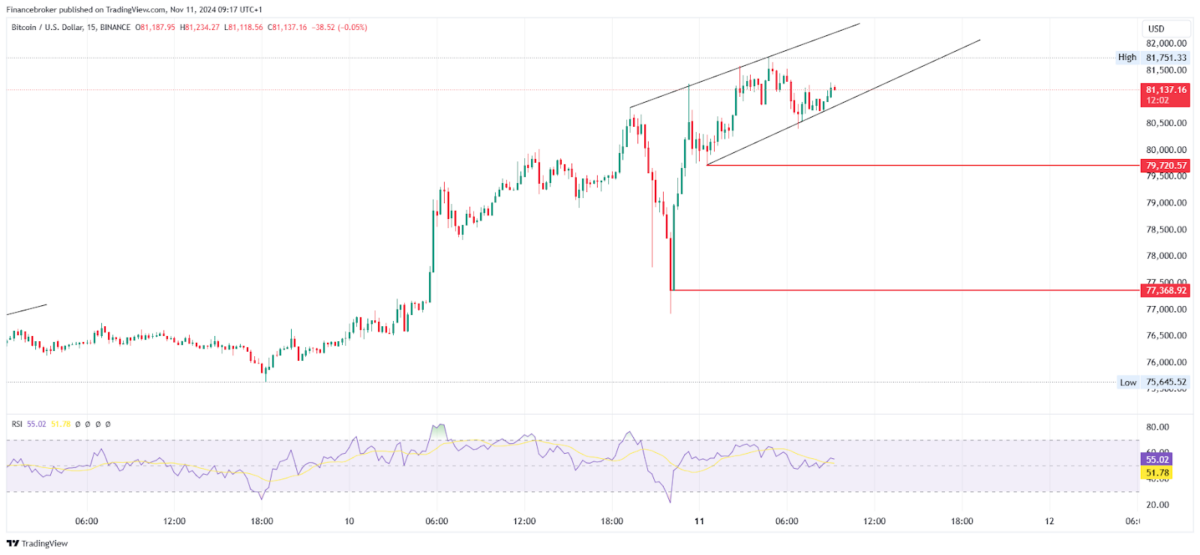
Bitcoin Chart Analysis
BTC/USD 15-Minute Time Frame
On the November 10, 2024 trading session, Bitcoin surged nearly 6%, reaching a new all-time high and extending its rally into the next session. Moreover, the price is currently in the overbought zone.
On the daily time frame, Bitcoin has formed six consecutive green candles, continuing its upward movement without any pause. The RSI on the daily chart also indicates overbought conditions, making it challenging for positional traders to hold their trades.
In the 15-minute time frame, price action continues to move upward, forming higher highs and higher lows, with the RSI remaining in a safe zone. Besides, the price is currently trending within a channel, maintaining its bullish structure.
For potential entries, consider the following triggers:
If the price pulls back to the supporting trendline, buyers may consider entering with a stop loss below the previous swing low and target based on a trailing basis.
If the price breaks below the supporting trendline and sustains under $79,720, sellers may consider entering with a stop loss above the previous swing high and targeting the $77,368 level.
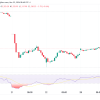
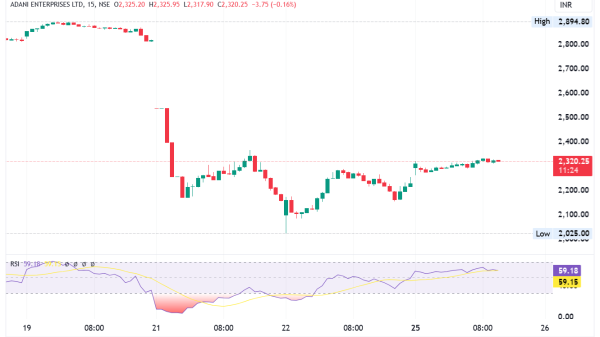
Ethereum Chart Analysis
ETH/USD 15-Minute Time Frame
On November 10, 2024, Ethereum continued its upward rally on both daily and 15-minute time frames. As of November 11, Ethereum appears to be consolidating on the daily chart, thus, allowing for potential new entries from buyers.
After breaking a major resistance level, Ethereum sustained its upward movement for three consecutive sessions. Currently, the price is consolidating, and if it breaks above the consolidation candle, positional buyers might consider entering the trade.
The price is following a higher high and higher low pattern, finding support from the trendline, with the RSI confirming the price action. Here are some potential entry points:
If the price breaks below the supporting trendline on the 15-minute time frame and continues its downward movement, sellers may consider entering with a stop loss above the previous swing high, targeting the $3,056 level.
If the price bounces off the supporting trendline, buyers may consider entering with a stop loss below the previous swing low, targeting the $3,237 level.
Both Bitcoin and Ethereum are currently in overbought territory on the daily time frame, so an abrupt pullback could occur. It is strongly recommended to use strict stop losses.
The post Bitcoin & Ethereum Analysis: BTC Hits High, ETH Is Steady appeared first on FinanceBrokerage.