


Overall Analysis
Oil turned out to be highly volatile on the 6th of November session, closing near the opening price, currently testing the previous swing.
Natural Gas went up by +4% on the 6th of November trading session. The price is currently in a zone, with the uptrend remaining intact after the election.
Oil Chart Analysis
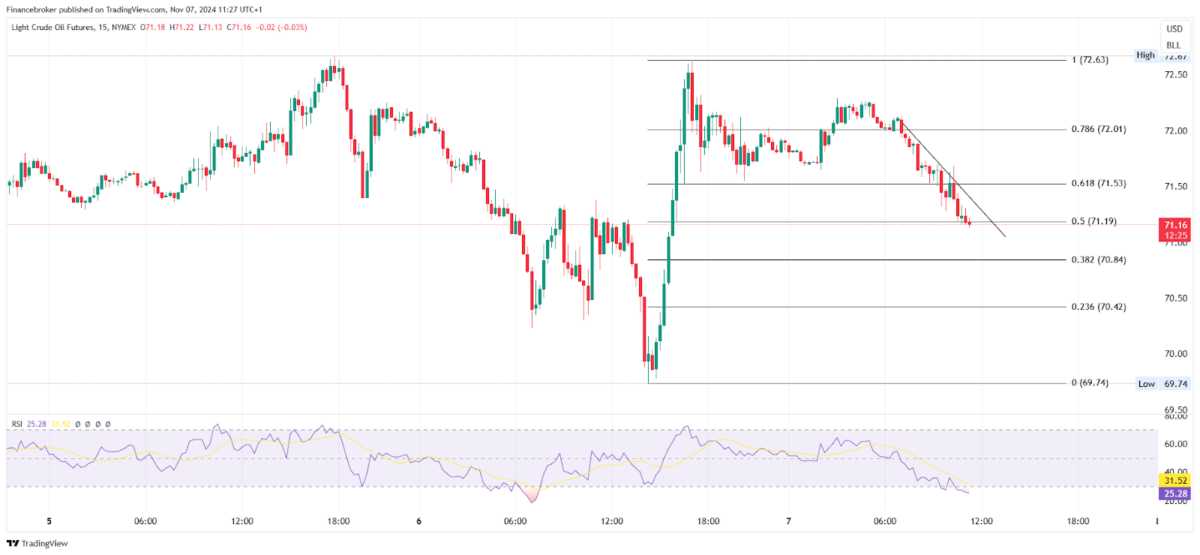
Oil/USD 15-Minute Chart (Source: TradingView)
On the 6th of November 2024 trading session, Oil turned out to be highly volatile as the market showed a sharp fall in the first half of the trading session but sharply reversed after making a day low of 69.74 and closing near the opening price. Initially, Oil was down by more than -3%.
Currently, in the 1-hour time frame, the price is moving upwards with swing creation. Oil is holding at higher levels as the previous swings are intact, and the 6th of November fall failed to break the previous swing low.
The price on the 15-minute time frame is testing the 0.5 fib retracement level of the previous swing. Hence, the price came down sharply, taking RSI into an oversold scenario. There are multiple entry triggers that can be used to create a position.
If the price fails to sustain above the 0.5 fib retracement level, then the seller can plan an entry with a stop loss above the previous swing high and a target up to the 70.42 level.
If the price reverses from the 0.5 fib retracement level and breaks the resistance trendline, then a buy-side entry can be made with a stop loss below the previous swing low and a target up to 72.50.
Natural Gas Chart Analysis
Gas/USD 15-Minute Chart (Source: TradingView)
On the 6th of November 2024 trading session, Natural Gas was strongly sideways in the first half but gave a breakout and reached nearly the +4.3% mark. Currently, the price is forming a peanut pattern-like structure.
Looking at the price on a daily time frame, there is a formation of a double bottom pattern, where the price shows a strong reversal from the previous swing level. Natural Gas is a bit sideways on the daily time frame. The price will show momentum once it breaks the 2.9010 level.
In the 15-minute time frame, the price currently moves in a peanut pattern, with a higher chance of breaking to the upside due to the ongoing uptrend. Traders can use a few entry triggers to plan an entry in Natural Gas.
If the price breaks the resistance trendline and closes above it, then one can enter with a stop loss below the previous swing low and a target up to 2.9010.
If the price reaches the supporting trendline and shows a reversal, plan an entry with a stop loss below the previous swing low and a target up to the resistance trendline.
The post Oil Breaks Key Pattern: Oil Volatility & Natural Gas Surge appeared first on FinanceBrokerage.