


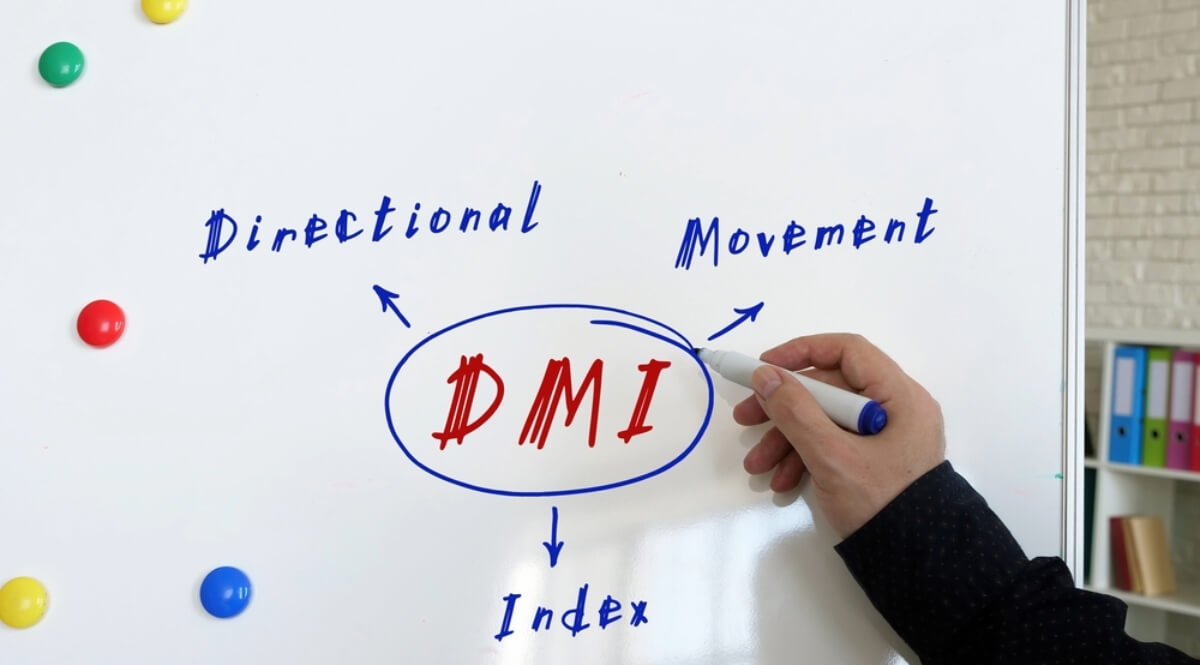
What Does DMI Stand for – Get All The Essential Information
Key takeaways:
DMI, or Directional Movement Index, is a crucial tool in market trading, helping investors predict price movements by analyzing past prices and current market conditions.
While offering valuable insights, DMI also carries risks experienced traders must acknowledge.
Components like the Positive Directional Indicator (+DI), Negative Directional Indicator (-DI), and Average Directional Index (ADX) are essential for DMI analysis.
DI indicates buying opportunities when surpassing -DI, while ADX measures momentum strength, guiding traders in navigating market trends confidently.
Have you recently wondered what DMI stands for? Why should you use it and how to calculate it exactly? First, DMI’s meaning is that it is the acronym for “directional movement index” and is a tool used in market trading.
It combines various metrics to project an asset’s price movement. Investors use the DMI to predict an asset’s price by looking at past prices and current market conditions.
Experienced traders should use the DMI for insights but must also be aware of its risks.
Let’s take a closer examination of how it works and what to consider, shall we?
DMI – Directional Movement Index Components
As we already mentioned, DMI stands for directional movement index, but what is it exactly? There are crucial DMI Components you need to learn to understand how to utilize DMI as a true professional. Here are the components to learn:
The Directional Movement Index (DMI)
It analyses an asset’s high, low, and closing prices. The main parts are the Positive Directional Indicator (+DI) and the Negative Directional Indicator (-DI). The Average Directional Index (ADX) compares them.
Positive Directional Indicator (+DI)
The Positive Directional Indicator (+DI) evaluates positive directional movement by comparing an asset’s current high price with its previous high within a specified time frame.
This comparison highlights upward pressure on the asset, often indicating a potential buy signal. A higher current high suggests a positive trend in the market, potentially signalling a favourable opportunity for traders.
A high ADX indicates a strong trend that will probably continue. A low ADX suggests a weak correlation and an unclear trend direction. Conversely, a lower current high indicates a lack of upward movement, suggesting a more neutral market stance.
Negative Directional Indicator (-DI)
The Negative Directional Indicator (–DMI) is a key component in technical analysis, functioning as a technical indicator.
The measure of the negative directional movement looks at the lowest price today and compares it to the lowest price yesterday. It adds up these differences over the last 14 periods. The results are then shown on a graph.
The ADX is important in analyzing market trends by smoothing out DX values within a framework. It provides further insights into market trends.
Average Directional Index (ADX)
The directional movement index (DMI) gauges both the intensity and trajectory of price movements, aiming to mitigate erroneous signals.
It evaluates the vigour and direction of price movements, filtering out false signals. It comprises two standard indicators, the negative (-DI) and positive (+DI), along with the average directional movement index (ADX), which measures momentum irrespective of direction.
This method carefully examines how prices move and includes the average directional movement index (ADX) to understand market momentum better.
How to calculate DMI?
To find DMI indicators, calculate Directional Movement (DM) daily. Decide if it’s +DM or -DM by looking at price changes.
Then, you derive +DI and -DI from these DM values, considering the asset’s directional movements and significant price shifts.
Finally, you compute a Directional Index (DX) from these indicators, with a higher difference indicating a larger DX. The Average Directional Index (ADX) is calculated from the historic DX values from averaging.
Utilizing DMI Indicators on Technical Charts
The DMI typically appears on a technical chart below the asset’s price details, featuring lines for the +DI in green, the -DI in red, and the ADX in black.
Utilizing DMI for Trading Strategies
To employ the DMI effectively in trading strategies, compare the +DI against the -DI. When +DI surpasses -DI, it signifies upward price pressure, often indicating a buying opportunity.
Conversely, when -DI exceeds +DI, it indicates downward price pressure, serving as a selling signal.
Interpreting ADX Strength in Trading Signals
The crossing of the +DI and -DI lines denotes shifts in asset momentum, which is crucial for trading signals. The ADX showcases the strength of an asset’s movement by comparing current and past price levels.
A high ADX indicates a strong trend that will probably continue. A low ADX suggests a weak correlation and an unclear trend direction.
Bottom line
To summarise what DMI stands for, or Directional Movement Index is a vital tool in market trading, combining various metrics to forecast an asset’s price movement. It aids investors in predicting market directions by analyzing past prices and current market conditions.
However, it’s crucial to recognize its risks. The DMI components, including the Positive Directional Indicator (+DI) and Negative Directional Indicator (-DI), along with the Average Directional Index (ADX), play significant roles in this analysis.
The +DI signals positive movement, suggesting buying opportunities when it exceeds -DI, which indicates downward pressure, signalling potential selling opportunities. ADX measures momentum strength, guiding traders;
A high ADX suggests a robust trend likely to continue, while a low ADX indicates uncertainty. Understanding DMI and its components enables traders to navigate volatile markets confidently.
The post What Does DMI Stand for – Get All The Essential Information appeared first on FinanceBrokerage.